Why do power grids dip every 60 seconds?
Every minute, the frequency of a large power grid slips down slightly and then recovers. The change is too small for most electricity users to notice. It has nevertheless been visible in grid measurements for years, on systems in Europe, North America, Asia, Africa and Australia.
A study published in Nature Energy on 30 October 2026 explains where it comes from. Researchers led by Dirk Witthaut at Forschungszentrum Jülich linked the dips to large battery systems that check their state of charge on a fixed 60-second cycle.
The clocks inside those systems are synchronised over the internet. A single charge check is imperceptible on a national grid. When many units run the check at the same second, the combined load becomes measurable.
Frequency is the shared pulse of an electricity system. Europe operates at 50 hertz and South Korea at 60 hertz. Frequency falls when demand briefly exceeds supply and rises when supply exceeds demand, so operators hold it inside a narrow band.
TenneT, Germany's largest transmission system operator, noticed the minute-long rhythm over several years. According to Jülich, the deviations were not critical to grid security. They were clearly measurable and unusually regular, and their cause was unknown.
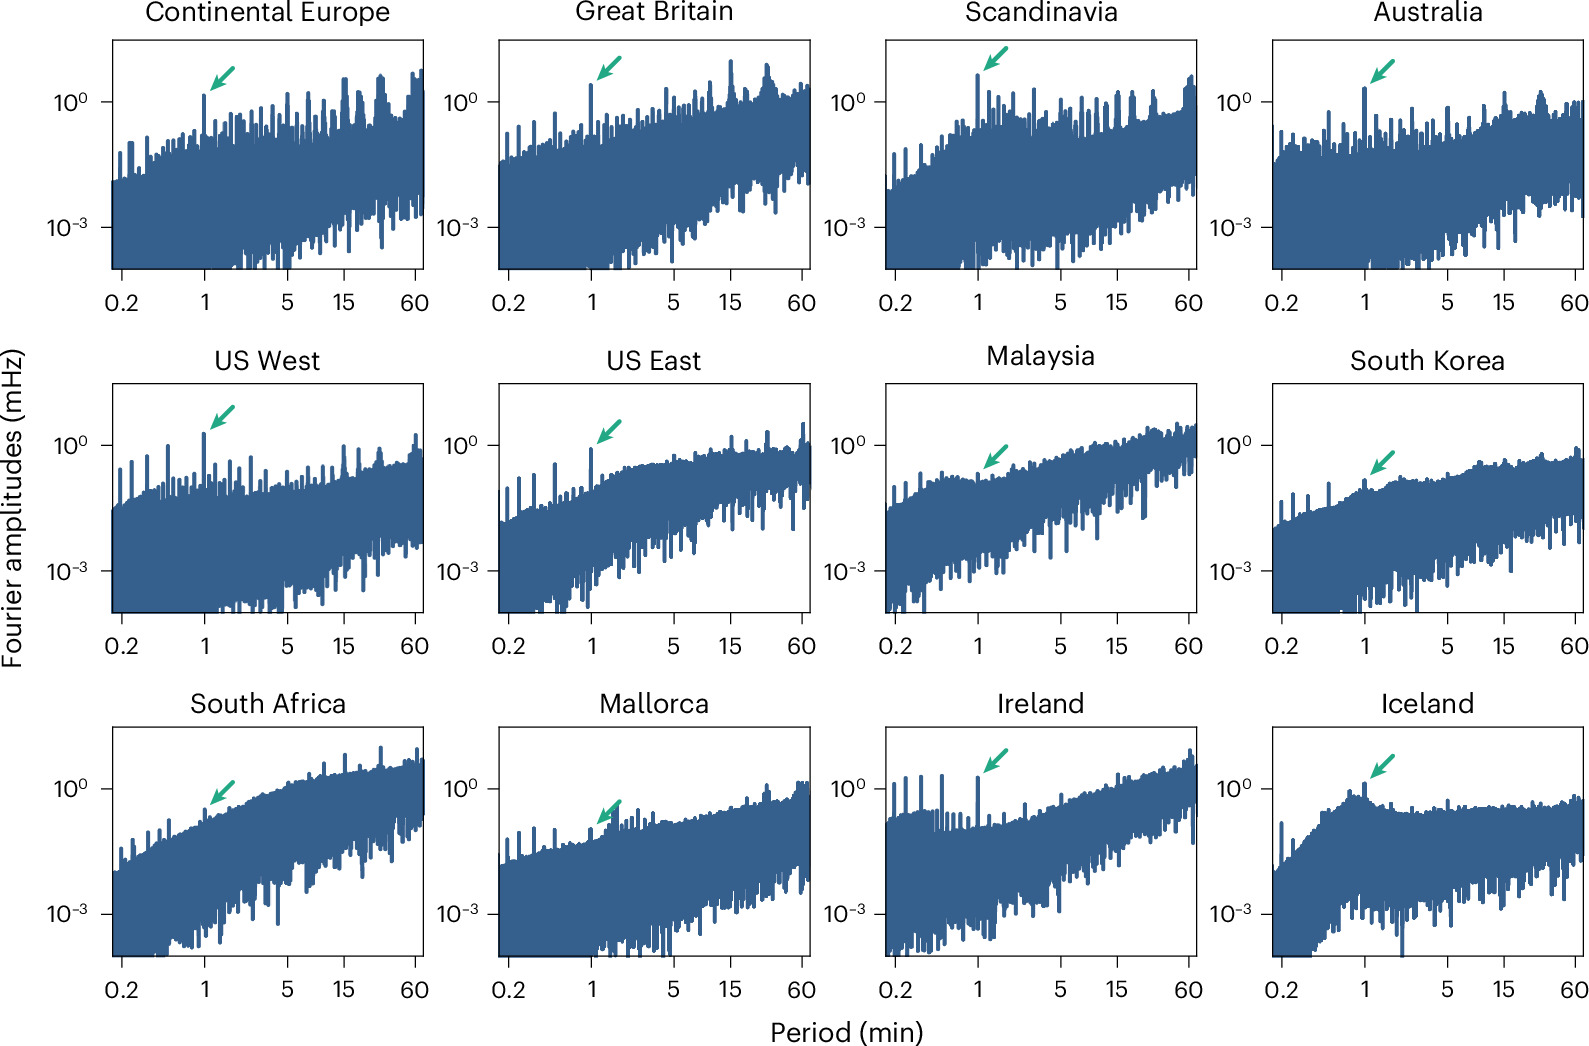
The published paper examines 12 grids on five continents. The set includes Continental Europe, Great Britain, Scandinavia, Ireland, Iceland, Mallorca, Australia, Malaysia, South Korea, South Africa and the eastern and western United States. Each shows a narrow peak at exactly one minute.
Low-frequency grid oscillations are not new. Hydropower plants have long been a known source, because turbine vibrations can grow at a resonant frequency. Those oscillations tend to come and go. The one-minute pattern persists for years, which is what made it a puzzle.
What did the Jülich campus measurements show?
The researchers began with hydropower. They built a computer model of a hydropower plant on the Scandinavian grid and looked for conditions that produced a one-minute resonance. They found some, but none that stayed stable for days at a time.
Persistence pointed to a clock. Witthaut said it quickly became clear to the team that the cause had to be something controlled by the clock. No other explanation fit a cycle that precise.
The team then measured its own campus. More than 80 power quality meters recorded frequency, voltage, current and power every three seconds. The site has transformers, solar panels, battery storage, uninterruptible power supplies and a high-performance computer.
Four buildings showed a regular one-minute change in electricity use. All four contained uninterruptible power supplies, the battery units that keep servers, laboratory equipment and hospital systems running during an outage. One campus unit is a 1.5 MW / 0.5 MWh battery used as a UPS.
The meters recorded a short current spike at the start of each minute. The manufacturer confirmed that the spike came from a routine self-check run by the battery management software. The signal passed through several transformers and remained detectable at the 110 kV connection to the high-voltage grid.
Not every unit behaved the same way. Two buildings produced a stable waveform. A third, fitted with equipment from a different manufacturer, drifted slowly, which the authors treat as evidence that control design matters.
A natural experiment on Mallorca supports the mechanism. An earlier preprint of the study reports that the island's grid showed the one-minute pattern only after a battery storage system was installed in 2024.
The campus work also showed how the effect crosses voltage levels. A disturbance created at a low-voltage socket does not stay there. It travels upward through the transformer hierarchy and joins the aggregate signal that a transmission operator sees.
Which power grids show the one-minute pattern?
The paper's central figure plots frequency spectra for all 12 grids. A spectrum splits a noisy signal into the cycles that make it up. In every panel, a sharp spike appears at a period of one minute, marked with an arrow.
The peak is extremely narrow, which the authors say points to a precisely defined frequency that is stable over years. That precision is a fingerprint of clocked software rather than a random physical disturbance.
The pattern is strongest in the large interconnected systems of Europe, North America and Australia. It is also visible in Iceland, South Korea, Malaysia, South Africa, Ireland and Mallorca. Grid size and market design change the amplitude, but not the timing.
The published version covers more ground than the original preprint, which was posted in October 2025 and examined nine grids. The preprint already reported that the amplitude was rising in the Nordic and British systems.
South Korea offers a useful comparison. Its grid is separate from Europe's and runs at a different nominal frequency. Chosun Biz reports that the same 60-second signal appeared in about three and a half months of Korean data.
Continental Europe shows the effect too, although its long-term trend is milder than in the British and Nordic systems. The preprint reports that amplitudes are higher during the day than at night and higher in summer than in winter.
The preprint also found stronger amplitudes during the COVID-19 lockdowns of spring 2020. That detail matters because it ties the signal to changes in how much equipment was running, rather than to a fixed property of any one grid.
For operators, the practical question is not whether the pattern exists. It is whether the amplitude is growing fast enough to affect reserves, equipment wear or the margins they keep for other disturbances.
How large is the effect in Ireland and the Nordic grid?
Ireland is the clearest case in the published data. The amplitude of the one-minute signal quadrupled between 2016 and 2021, rising from about 3 millihertz to about 12 millihertz. Some recent drops have exceeded 20 millihertz.
A millihertz is one thousandth of a hertz, so these are small numbers in absolute terms. The trend is what drew attention. It coincides with a rapid expansion of data centres, which rely on large fleets of UPS batteries.
By 2022, data centres accounted for about 18% of national electricity consumption in Ireland. Jülich describes the share as around a fifth of the country's demand. Each facility adds more batteries that check their charge on the same schedule.
The Nordic grid shows a different version of the problem. The preprint reports that the amplitude regularly exceeds 10 millihertz. In that market, a frequency-containment product known as FCR-N has no deadband, so a deviation of this size can trigger a control response.
That response has a cost. Reserve activation means other units adjust their output to offset a disturbance that is, in effect, scheduled by software. The preprint argues that the pattern adds to other deterministic and random disturbances.
Great Britain and Continental Europe show rising amplitudes as well, according to the preprint, though the continental trend is milder. The British grid data in the preprint runs from 2014 to 2021.
The absolute size of the dip needs context. Ireland's 50 hertz grid is designed to withstand swings of plus or minus 200 millihertz. Its operator would rather keep deviations within 100 millihertz, according to TechCrunch.
On that scale, 12 to 20 millihertz is a fraction of the permitted range. It does not mean a blackout is imminent. It does mean the grid is using part of its margin on a disturbance that serves no operational purpose.
There is also a fairness question inside the grid. A data centre operator gains reliable backup power from its UPS fleet. The frequency cost of synchronised checks is spread across every user connected to the same synchronous area.
Why does a tiny frequency dip matter?
The most direct physical cost falls on hydropower. When demand spikes for a second, the turbine slows slightly and then accelerates back to its original speed. Repeated minute after minute, that cycling adds wear to the machine.
The Nature Energy abstract notes that the pattern is contributing to wear and tear in hydropower systems. It also says the effect is motivating stricter frequency-control requirements in some markets.
The second cost is headroom. Frequency excursions from other causes add to the one-minute dip rather than replacing it. A generator trip or a large industrial load switching on can arrive at any second, including the busy start of a minute.
The third cost is control effort. If the dip repeatedly crosses a reserve threshold, the system pays for corrections it would not otherwise need. That is the Nordic concern, where the preprint says the pattern regularly triggers reserve activation.
The fourth is future risk. Grids are losing the spinning mass that once smoothed frequency changes, as inverter-based wind and solar replace conventional generators. The preprint frames the one-minute pattern as a burden that grows as inertia falls.
None of this makes the pattern an emergency. The published research describes a measurable inefficiency and a source of wear, not an immediate threat to supply. That distinction matters when operators decide how much attention and money to give it.
The effect is also a reminder that grid stability is not only a question of copper and turbines. Software schedules, firmware versions and network time protocols now shape the demand curve seen by a transmission operator.
For data centre operators, the finding adds a question to procurement. Backup power is chosen for reliability and capacity. The timing of the battery self-check is rarely part of the specification, yet it can show up on a national grid.
For manufacturers, the lesson is that a default interval is a design decision with external effects. A round number chosen for convenience can become a synchronised load across an entire region.
How can battery makers stop the synchronisation?
The proposed fix is to break the synchronisation. Instead of checking at the start of every minute, each device would choose a random point within a window. The average load stays the same, but the peaks no longer align.
Witthaut put it plainly: "You would simply have to distribute the checks randomly, rather than always starting them at the same time."
That is a software change, not a hardware replacement. At least one manufacturer has already made it. Chosun Biz reports that a battery maker modified its management program so current increases for some batteries no longer recur at one-minute intervals.
There is no binding standard for the interval today. Jülich says most manufacturers appear to have assumed that 60 seconds was a sensible period, with the start of the minute as the obvious schedule. That shared assumption produced the shared rhythm.
Randomisation alone will not cover every device. Some equipment is installed for a decade or more and receives few updates. TechCrunch, citing a recent study, reports that less than 3% of internet-of-things devices run the latest firmware.
The paper's conclusion is broader than one patch. It calls for improved control design as battery storage, data centres and the internet of things expand, and it treats the one-minute case as an example of a wider class of cyber-physical effects.
Standards bodies could specify a randomised schedule, or a maximum permitted synchronisation. Grid operators could include the requirement in connection agreements. Manufacturers could ship it as a default rather than an option.
Each route has trade-offs. Random schedules make some diagnostics harder to interpret, and predictable test windows are easier to audit. Those trade-offs help explain why a technically simple fix can still take years to spread.
The alternative is to leave the timing alone and manage the consequence. That would mean procuring more reserve, accepting more wear, or tightening frequency limits elsewhere. None of those options is free.
What should grid operators and buyers watch next?
Ireland is the first place to watch. Its data centre load is large relative to the size of its grid, and its one-minute amplitude has grown quickly. If firmware randomisation spreads, the Irish signal should weaken.
South Korea is the second. A separate grid on a different nominal frequency that shows the same pattern is strong evidence that the mechanism is general. It also means the fix has to travel across jurisdictions.
Buyers can act before regulators do. A procurement team can ask how often the battery management system runs a self-check and whether the interval can be randomised. Most specification sheets do not answer that question today.
The study has limits. The campus evidence is detailed but local, and the grid evidence is observational rather than a controlled experiment. The authors cannot rule out other clocked appliances.
Witthaut said it cannot be ruled out that air-conditioning systems, heat pumps, washing machines and dishwashers show similar patterns. If they do, the one-minute dip could survive the battery fix.
The wider lesson is about measurement. The pattern was visible for years before anyone could explain it, because it was small enough not to threaten security and nobody had traced its source.
Better monitoring at the distribution level would make such effects easier to spot. The Jülich campus work relied on meters that sampled every three seconds, catching detail that coarser monitoring would miss.
The paper is open access and includes a methods section describing its data sources and processing. That makes independent checks likely, especially in grids with fast-growing data centre loads.